Fixes to Try First In This Order
1. Check the full URL and port number.
2. Open the page in a private/incognito window or another browser.
3. Clear the browser cache and restart.
4. Disable all extensions (especially privacy/security tools).
5. Temporarily disconnect any VPN or proxy.
6. If you’re a developer: start the dev server before launching the debugger or app.
If the error persists, follow the detailed steps below that match your situation.
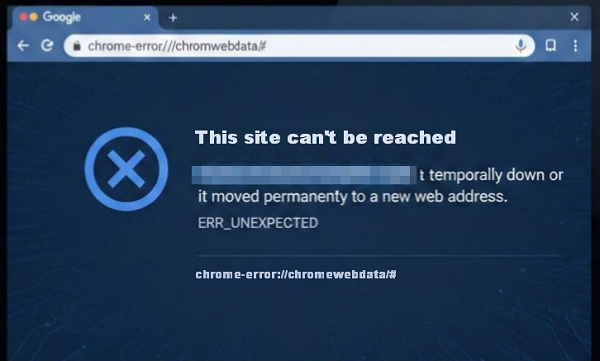
What chrome-error://chromewebdata/# Means?
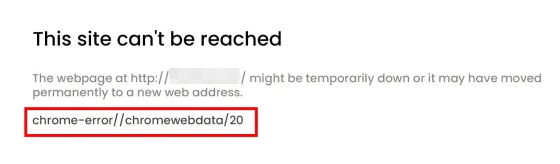
It is the browser’s own internal fallback page that appears whenever it fails to load the requested resource. The same visible error has three main causes:
- Everyday browsing: wrong URL/port, network/DNS issue, extension, VPN/proxy, or the site is down.
- Development/debugging: DevTools tried to load a source map (.map file) but the local dev server wasn’t running or the path was wrong.
- Embedded browsers (Electron, Cypress, test runners, app wrappers): the UI launched before the local server was ready (classic race condition).
Quick Decision
Other websites load normally → Everyday browsing issue.
Happening while debugging a local app and DevTools shows “Could not read source map…” → Developer / source-map issue.
Appearing inside an Electron app, Cypress test, or any embedded browser → Embedded / automation issue.
For Everyday Users (Non-Developers)
1. Verify the full URL and port (difficulty: very low)
Look for typos or an unexpected port at the end (e.g., :3000, :8080, :14). Public websites normally use port 80 for HTTP or 443 for HTTPS.
For local services, include the correct port explicitly: http://localhost:3000 or http://192.168.1.5:3000.
2. Confirm the site/server is actually online (difficulty: very low)
Open the same URL on another device (phone) or a different browser. If it fails everywhere, the issue is almost certainly server-side — contact the site owner.
3. Clear browser cache (difficulty: low)
Menu → Settings → Privacy & security → Clear browsing data → Time range = All time → Check only “Cached images and files” → Clear data. Restart the browser and reload the page.
Tip: Sites may load a little slower the first time, that’s normal.
4. Test in private/incognito mode & disable extensions (difficulty: low)
Press Ctrl+Shift+N (Windows) or Cmd+Shift+N (Mac). If the page loads there, suspect extensions or cached data.
Disable extensions: Go to the extensions page, toggle off all extensions, reload, then enable extensions one-by-one to find the culprit.
5. Temporarily disable VPN/proxy (difficulty: very low)
Disconnect from any VPN or disable any proxy in your browser or OS. Retry the URL. Some VPN/proxy endpoints can block or misroute traffic.
Tip: If the page loads after disabling your current proxy but you still need to browse through a proxy (geo-restricted content, testing, privacy, etc.), switch to a reliable residential proxy(rarely triggers this type of connection error).
6. Network & DNS checks (difficulty: low)
Copy-paste these commands in your terminal:
Windows PowerShell
# Flush DNS cache
ipconfig /flushdns
# Test connectivity to example.com on port 80
Test-NetConnection -ComputerName example.com -Port 80
macOS / Linux Terminal
# Check whether port 80 is accepting connections
nc -zv example.com 80
# Check HTTP headers (replace PORT if needed)
curl -I http://example.com:PORT/
If the port test fails, try switching to public DNS (1.1.1.1 or 8.8.8.8) temporarily in your network settings and retry. If the commands show the port is closed or the site only fails from your network, the site may be blocking your IP or region. In that case, a high-quality ISP proxy lets you quickly test the page from a different location without changing your main connection.
7. Advanced fixes (difficulty: medium → high)
Run a full malware/antivirus scan if you see other strange system behavior.
Create a new browser profile: Profile icon (top-right) → Add → Create a new profile, test the page there.
Reset browser settings to defaults (removes extensions/site data but keeps synced items in most setups).
Uninstall and reinstall the browser as a last resort — make sure bookmarks/passwords are synced/backed up first.
For Developers (DevTools & Source-Map Errors)
If DevTools prints a message such as:
Could not read source map for chrome-error://chromewebdata/neterror.rollup.js.map: HTTP error 503 — it usually means DevTools tried to fetch a .map file for an error page or resource the dev server did not serve.
1. Start your dev server before launching the debugger (difficulty: very low)
Manually run your start command (e.g., your project's start script) and confirm index.html and assets are served, then open the page or attach the debugger.
2. Add a pre-launch/startup task in your code editor (difficulty: low)
Many editors support a launch.json or similar configuration to start a server automatically before launching a browser. The idea is to ensure the server is running before the debugger opens.
{
"version": "0.2.0",
"configurations": [
{
"name": "Launch Browser (local)",
"type": "pwa-chrome",
"request": "launch",
"url": "http://localhost:3000",
"preLaunchTask": "start-server",
"webRoot": "${workspaceFolder}"
}
]
}
Tip: Ensure your preLaunchTask runs the command that starts your dev server (the start script for your project).
3. Use a “wait for readiness” routine to prevent race conditions (difficulty: low → medium)
Add a small script to delay UI launch until the server accepts connections.
Bash wait-for-port.sh
HOST=localhost
PORT=3000
while ! nc -z $HOST $PORT; do sleep 0.5; done
echo "Server is ready"
# then launch your test/app
Node.js health-check poll
// wait-for-health.js
const http = require('http');
function wait(url, timeout = 30000) {
const start = Date.now();
return new Promise((resolve, reject) => {
(function poll() {
http.get(url, res => {
if (res.statusCode === 200) return resolve();
if (Date.now() - start > timeout) return reject(new Error('timeout'));
setTimeout(poll, 500);
}).on('error', () => {
if (Date.now() - start > timeout) return reject(new Error('timeout'));
setTimeout(poll, 500);
});
})();
});
}
4. Check source-map references and DevTools Network log (difficulty: low)
Verify that your .map file URLs match the served paths. In production, disable source-map generation to avoid noisy errors.
In the browser developer tools: Open Network → enable Preserve log → reload → inspect failed requests (4xx/5xx) to find the root URL that failed.
For Embedded Browsers, App Wrappers & Automated Test Runners
When an embedded UI (an app wrapper, automation, or test runner) displays it, the usual issues are timing/race conditions or incorrect internal addresses.
1. Use explicit internal addresses and correct ports (difficulty: low)
Prefer http://127.0.0.1:3000 or http://localhost:3000 rather than ambiguous or relative paths.
2. Add retries and timeouts around navigation (difficulty: medium)
If the first navigation attempt fails, retry a few times with short delays — this mitigates transient startup timing issues.
3. Implement a lightweight /health endpoint (difficulty: medium)
A simple endpoint that returns 200 OK quickly helps launchers confirm readiness before opening UI.
4. Collect reproducible logs for debugging (difficulty: medium → high)
Capture: application logs, console output, the exact failing URL with port, and a short script that reproduces the issue — then file an issue with the project or pass to the maintainer/support team.
How to Contact The Site Admin(When Only One Site Fails)
If the problem is isolated to one site and other sites load fine, send this to the site admin to speed up diagnosis:
Please check server logs for the request:
- Failing URL (include port): http://example.com:PORT/
- Exact timestamp (timezone): 2026-02-13T09:15:00 +08:00
- Output of: curl -I http://example.com:PORT/
- Screenshot of browser error page (chrome-error://chromewebdata/#)
- Browser version and OS
- Steps I tried: cleared cache, disabled extensions, flushed DNS
This allows admins to find the incoming request in logs and determine why their server didn’t respond.
FAQs
Q: Is this a virus?
A: Almost never. It’s typically a connection or configuration issue. Still run a malware scan if you notice other suspicious behavior.
Q: Why does a port like :14 appear?
A: That port number indicates which port the browser attempted to reach; nothing answered on that port.
Q: Why only in my app/test runner?
A: The embedded UI often started before the server was ready — a classic race condition. Use a readiness check or wait loop.
Prevention & Best Practices
Clear cache monthly and keep extensions minimal.
Keep your browser updated.
For development: always start the server before debugging and add readiness checks.
For embedded/test environments: prefer health endpoints, retry logic, and explicit internal addresses.
Final Thoughts
The chrome-error://chromewebdata/# message is the browser saying, “I couldn’t load that resource.” For most users, the first three quick fixes solve it in minutes. For developers and automation engineers, enforcing server readiness eliminates the problem permanently.


