
Error 1009: What It Means, Diagnose & Fix Guide
Error 1009 can mean different things in Cloudflare, Windows, streaming apps, App Store downloads, QuickBooks, and legacy games. Identify your case and follow the right fix.
Mar 19, 2026


Learn how to inspect element in Chrome, Edge, Firefox, and Safari. Open DevTools, edit HTML and CSS, fix blocked right-clicks, and test mobile layouts.
If you have ever wanted to see how a button is styled, find out why a page looks broken, or check how a website behaves on mobile, Inspect Element is the fastest tool to start with. It opens your browser’s built-in developer tools so you can view the page’s HTML, inspect CSS rules, test responsive layouts, and make temporary changes in your browser. For beginners, it is one of the easiest ways to understand how websites are built.
In this guide, we will explain how to inspect element, how to open it in different browsers, how to select the exact part of a page you want, how to edit text and styles, and how to use it for mobile testing.
The fastest way to inspect element is:
Right-click the page and choose Inspect
Or use the keyboard shortcut:
Then click the element picker icon to select any part of the page
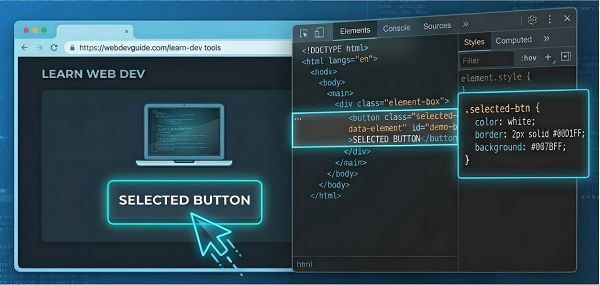
Inspect Element opens your browser’s developer tools and shows the live structure behind the page you are viewing.
With it, you can see:
The HTML structure of the page
The CSS rules affecting each element
Spacing details like margin, padding, and border
JavaScript errors and console messages
Responsive behavior on different screen sizes
It is useful for learning, testing, and debugging, but it does not change the live website for everyone else.
Can: view HTML/CSS, test edits, inspect layout, check responsive behavior
Cannot: permanently change the site, affect other users, bypass server-side restrictions
A lot of beginners confuse these two tools.
View Page Source shows the original HTML sent by the server.
Inspect Element shows the live page structure after the browser has built and updated it.
That difference matters because many websites load content dynamically with JavaScript. In those cases, what you inspect in the browser may look different from the original source code.
If you want to see what the browser is actually displaying right now, Inspect Element is usually the better tool.
There are three common ways to open it.
This is the easiest method.
1. Right-click the part of the page you want to check.
2. Choose Inspect/Inspect Element.
3. The developer tools open and highlight that exact element.
This is the best starting point for beginners because it takes you directly to the right code.
| Browser | Open DevTools | Element Picker |
| Chrome / Edge / Firefox | Ctrl + Shift + I | Ctrl + Shift + C |
| Safari (Mac) | Cmd + Option + I | Cmd + Shift + C |
If you do not want to use shortcuts, open it through the browser menu.
1. Click the browser menu icon.
2. Look for More tools/Developer tools.
3. Open the developer tools panel.
Menu names vary slightly by browser, but the feature is usually easy to find.
Most desktop browsers support Inspect Element in a similar way.
Chrome, Edge, and Firefox: shortcuts and right-click inspection work well
Safari on Mac: you may need to enable the Develop menu in Safari settings first, then use the developer tools shortcut or right-click inspection
If the panel opens at the bottom of the screen, you can usually drag the border to resize it or move it to the side.
Some websites block the right-click menu, but that does not stop you from using Inspect Element.
Use the element picker instead:
1. Press Ctrl + Shift + C on Windows/Linux or Cmd + Shift + C on Mac.
2. Your cursor changes into a selection tool.
3. Move your mouse over the page.
4. Click the element you want to inspect.
You can also open the developer tools first with Ctrl + Shift + I or Cmd + Option + I, then click the element picker icon in the panel.
This works even when the page disables right-click.
Once Inspect Element is open, the next step is finding the right element.
The easiest method is the element picker:
1. Open Inspect Element.
2. Click the picker icon (usually shown as a square with an arrow) at the top left.
3. Hover over the page until the correct section is highlighted.
4. Click it.
The matching HTML is now highlighted.
You can also use search inside DevTools:
Then search for a word, class name, ID, or even a color value to jump straight to it.
Any changes you make in Inspect Element are temporary. They only affect your browser session and disappear when you refresh the page.
Use this when you want to test different wording, headlines, or button labels.
1. Open Inspect Element.
2. Select the text element.
3. Double-click the text in the HTML view.
4. Type the new text.
5. Press Enter.
This is helpful for testing copy length and layout changes.
Use this when you want to make a structural change.
1. Select the element in the Elements panel.
2. Right-click the HTML line.
3. Choose Edit as HTML.
4. Make your changes.
5. Press Enter.
Start small so you can clearly see what changed.
If you want to change how an element looks, use the Styles panel.
1. Select the element.
2. Find the Styles panel.
3. Click property value such as color, font-size, or margin.
4. Type a new value
5. Press Enter.
The page updates live as soon as you make the change.
This is useful for testing:
text size
spacing
colors
alignment
borders
visibility
Tip: Click the filename next to a rule, such as styles.css:42, to jump to the actual stylesheet location.
Some elements only change when you hover over them or click them. Inspect Element lets you test those states directly.
1. Select the element.
2. Right-click the HTML line.
3. Choose a forced state such as:
:hover
:focus
:active
:visited
This is helpful for testing:
dropdown menus
button effects
tooltips
link states.
There are two common cases.
For <img> tags:
1. Double-click the src="..." value.
2. Paste a new image URL.
For CSS background images:
1. Open the Styles panel.
2. Edit the background-image property.
This is useful for testing different visuals without changing the live site.
You may want to see how a page looks without a banner, sidebar, pop-up, or section.
1. Open Inspect Element.
2. Select the element.
3. Right-click the highlighted HTML line.
4. Choose Hide element or Delete element, depending on the browser.
This is useful for testing cleaner layouts or removing distractions.
Refresh the page to restore everything.
You may also be interested: How to Enable Scrolling in Inspect Element: 5 Proven Methods
This is one of the most valuable features for beginners, designers, and SEO users.
1. Open Inspect Element.
2. Click the phone/tablet icon, often called Device Mode or Toggle Device Toolbar.
3. Choose a device preset or drag the window to a custom size.
4. Switch between portrait and landscape.
5. Optionally test slower network speeds or touch behavior.
A good starting point is the Responsive preset, because it lets you drag freely and quickly spot layout issues.
This is especially useful for checking:
mobile menus
text wrapping
image scaling
button spacing
layout shifts
hidden content on small screens.
Pro Tip: Responsive mode checks screen size, while proxies help test location-based differences.
A few simple habits make Inspect Element much easier to use:
Start with the element picker instead of guessing in the code tree
Change one thing at a time
Use search when the page is large
Refresh the page to clear temporary changes
Copy elements when you need to save code for reference
If you are new, focus on understanding the page layout first before trying to edit everything at once.
1. Editing the wrong element
Sometimes the highlighted element is a parent container, not the exact text or button you want.
2. Forgetting that changes are temporary
Inspect Element changes only affect your local browser session. They do not update the real website.
3. Changing too many things at once
Make one edit, then check the result before making another.
4. Looking in the wrong panel
If you are trying to change the appearance, use the Styles panel.
If you are trying to change the structure or text, use the Elements panel.
Can I use Inspect Element on any website?
You can use it on most desktop websites. Some sites block right-click, but keyboard shortcuts and the element picker still work.
Why do my changes disappear after refresh?
Because Inspect Element only changes the page in your browser session. Refreshing reloads the original version.
Can I inspect element on mobile?
The easiest method is to use desktop browser device mode. For more advanced mobile debugging, developers often use remote debugging from a desktop computer.
Is Inspect Element legal?
Yes. It is a built-in browser feature for viewing and testing the page in your own browser.
Which browsers support Inspect Element?
Most major desktop browsers support it, including Chrome, Edge, Firefox, and Safari.
When would I need a proxy service with Inspect Element?
Proxies are useful when you need to test location-based content, regional redirects, or page variations from different IPs.
Learning how to inspect element is one of the fastest ways to understand how websites are built. It helps you view HTML, adjust CSS, test layouts, inspect mobile views, and troubleshoot visual issues without touching the live site.
Try now:
1. Right-click anywhere on a page and choose Inspect.
2. Use the element picker to select a headline or button.
3. Double-click the text in the HTML panel and change it.
4. Refresh the page when you are done.
After a few tries, Inspect Element becomes an easy and practical tool for learning, debugging, and testing web pages.
Next >


 Cancel anytime No credit card required