
How to Use Whoer IP for IP Checks: A Step-by-Step Guide
Discover how to use Whoer.net to check and verify your IP address. Explore top alternatives for comprehensive IP management .
Apr 2, 2026


Learn 3 clear methods—Pytrends, JSON endpoints, Selenium—plus rotating GoProxy tips to reliably scrape Google Trends data.
Google Trends uncovers real-time and historical search interest by topic, region, and related queries. However, without an official public API, extracting this data at scale requires a mix of approaches—and smart proxy management to avoid rate limits and IP bans. In this guide, you’ll learn three clear methods—Pytrends, direct JSON endpoint calls, and Selenium browser automation—enhanced with GoProxy rotating proxies to keep your scraper running smoothly.
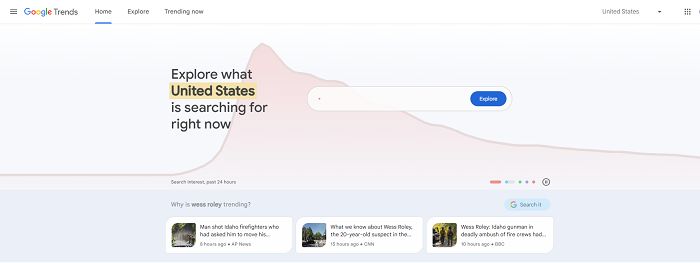
Google Trends is a free and powerful online tool visualizing the popularity of search queries on Google Search. It aggregates anonymized, sampled data and displays relative search interest on a scale from 0 to 100. Users can apply filters—such as time range, geographic region, categories, and search type—to explore topics, compare multiple keywords, view related queries, and track trending searches in real time or historically.
Scraping it helps:
Scale Analysis: Automate the collection of large volumes of historical interest-over-time data for dozens or hundreds of keywords simultaneously.
Pipeline Integration: Feed Trends data directly into dashboards, machine-learning models, or reporting systems without manual downloads.
Custom Queries: Schedule and parameterize requests for specific regions, date ranges, or related-query insights tailored to your research needs.
Competitive Edge: Monitor emerging topics programmatically, enabling faster, data-driven decisions in SEO, market research, product development, and strategy.
Before you begin, please note:
Respect Google’s Terms of Service. Keep a reasonable request volume and rotate IPs to avoid aggressive scraping.
Public Data = Public, but not unlimited. Google Trends data is publicly visible; responsible scraping is accepted, such as low concurrency and appropriate backoff.
Attribute Your Source. When you publish extracted data, clearly credit “Google Trends” in reports or dashboards.
With these guardrails in place, let’s explore the three methods.
| Method | Beginner-Friendly | Scalability | Key Dependencies | Best for |
| 1. Pytrends Wrapper | ★★★★★ | ★★☆☆☆ | pytrends, pandas | Quick prototypes with simple keywords |
| 2. JSON Endpoint Calls | ★★★☆☆ | ★★★★☆ | httpx, pandas | Precise control & historical loops |
| 3. Selenium + BS4 | ★★☆☆☆ | ★★☆☆☆ | selenium, bs4 | Dynamic pages or widget scraping |
1. Python 3.8+ installed on your machine.
2. A virtual environment to isolate dependencies:
bash
python3 -m venv venv
source venv/bin/activate
3. Proxy Configuration
Choose reputable providers offering reliable rotating proxy service with your target location IPs, like GoProxy. Sign up and obtain your proxy endpoint and authentication token.
Store credentials securely in .env:
bash
GOPROXY_URLS=http://user:pass@proxy1:8000,http://user:pass@proxy2:8000
4. dotenv library to load credentials:
bash
pip install python-dotenv
5. GoProxy Rotating Selection
python
import os, random
from dotenv import load_dotenv
load_dotenv()
proxy_list = os.getenv("GOPROXY_URLS", "").split(",")
def get_random_proxy():
url = random.choice(proxy_list).strip()
return {"http": url, "https": url}

Pytrends offers high-level functions to fetch interest-over-time, related queries, and regional breakdowns with minimal code.
bash
pip install pytrends pandas python-dotenv
python
from pytrends.request import TrendReq
pt = TrendReq(
hl="en-US",
tz=360,
requests_args={
"proxies": get_random_proxy,
"timeout": 10
}
)
python
keywords = ["data science", "machine learning"]
pt.build_payload(keywords, timeframe="today 12-m", geo="US")
python
df = pt.interest_over_time()
if "isPartial" in df.columns:
df = df[df["isPartial"] == False]
df.to_csv("interest_over_time.csv")
python
related = pt.related_queries()
regions = pt.interest_by_region(resolution="COUNTRY")
related["data science"]["top"].to_csv("related_queries.csv")
regions.to_csv("interest_by_region.csv")
python
import matplotlib.pyplot as plt
df[keywords].plot(figsize=(8,4))
plt.title("Search Interest Over Time")
plt.tight_layout()
plt.savefig("trend_plot.png")
429 Errors: Batch keywords (≤5), add time.sleep(30) between requests.
Timeouts: Increase timeout or wrap calls in retry logic.
Partial Flags: Always drop rows where isPartial == True for clean data.
Pull raw JSON from Google’s internal APIs for full control over parameters and historical loops.
bash
pip install httpx pandas python-dotenv
python
import httpx
client = httpx.Client(timeout=10)
python
url = ("https://trends.google.com/trends/api/widgetdata/relatedsearches"
"?hl=en-US&tz=-480&req=<encoded_req>")
resp = client.get(url, proxies=get_random_proxy())
text = resp.text.lstrip(")]}',")
data = resp.json()
python
import pandas as pd
keywords = data["default"]["rankedList"][0]["rankedKeyword"]
df = pd.json_normalize(keywords)
df.to_csv("related_searches.csv", index=False)
python
from datetime import date, timedelta
all_dfs = []
for i in range(7):
day = (date.today() - timedelta(days=i)).strftime("%Y%m%d")
daily_url = (f"https://trends.google.com/trends/api/dailytrends"
f"?hl=en-US&ed={day}&geo=US")
r = client.get(daily_url, proxies=get_random_proxy())
text = r.text.lstrip(")]}',")
j = r.json()
# parse j into DataFrame and append to all_dfs
all_df = pd.concat(all_dfs)
all_df.to_csv("daily_trends_week.csv", index=False)
Strip the ")]}'" prefix before parsing. Check for missing keys on weekends or small markets.
Endpoint Breakage: Re-inspect network calls if Google changes parameters.
Empty Results: Skip or log days with no data.
Automates a real browser to render dynamic content, ideal when JSON endpoints aren’t enough.
bash
pip install selenium beautifulsoup4 python-dotenv
# Download matching ChromeDriver
python
from selenium import webdriver
def make_driver():
proxy = get_random_proxy()["http"]
opts = webdriver.ChromeOptions()
opts.add_argument("--headless")
opts.add_argument(f"--proxy-server={proxy}")
return webdriver.Chrome(options=opts)
driver = make_driver()
python
driver.get("https://trends.google.com/trends/trendingsearches/daily?geo=US")
try:
btn = driver.find_element_by_xpath("//button[text()='I agree']")
btn.click()
except:
pass
python
import time
while True:
try:
more = driver.find_element_by_css_selector(".load-more-button")
more.click()
time.sleep(2)
except:
break
python
from bs4 import BeautifulSoup
soup = BeautifulSoup(driver.page_source, "html.parser")
titles = [el.text for el in soup.select(".feed-item .title")]
python
import pandas as pd
pd.DataFrame({"trend": titles}).to_csv("selenium_trends.csv", index=False)
driver.quit()
CAPTCHAs: Rotate proxies more aggressively; slow down interactions.
Selector Changes: Update CSS/XPath if Google redesigns the page.
Randomize delays, batch small requests, and rotate proxies.
Use residential proxy pools in GoProxy; monitor for challenge pages.
Filter out incomplete entries (isPartial).
Cross-check results between methods for mission-critical pipelines.
Pandas → CSV/Database for long-term storage.
Matplotlib for quick charts:
python
df.plot(figsize=(8,4)); plt.tight_layout(); plt.show()
Dash/Streamlit for dashboards (next-level integration).
No single “best” method exists; choose based on your scenario:
With GoProxy rotating residential proxies, you’ll avoid rate limits, minimize blocks, and keep your scraper running smoothly. Start with Method 1 to learn the basics, then graduate to Methods 2 or 3 as your requirements grow.
< Previous
Next >


 Cancel anytime No credit card required